2 High-level revenues, costs, staff and balance sheet data
2.1 Revenues and traffic
This chapter provides a preliminary overview of high-level revenues, costs and staff data provided in ANSPs ACE 2024 data submissions.
Total ANS revenues in 2024 amounted to €12 002M. Most en-route revenues come from the collection of en-route charges (95.8%, see left pie chart). The proportion of terminal revenues from charges is lower (73.7%, see right pie chart), as additional income may directly come from airport operators (17.5%) through, for example, a contractual arrangement between the ANSP and the airport operator.
| En-route | % | Gate-togate revenues (€ M) | % | Terminal |
|---|---|---|---|---|
| 9 235 | 95.8% | Income from charges | 73.7% | 1 742 |
| n.a. | n.a. | Income from airport operators | 17.5% | 415 |
| 0.4 | 0% | Income from the military | 0.05% | 1.1 |
| 56 | 0.6% | Income in respect of exempted flights | 2.2% | 52 |
| 61 | 0.6% | Income from domestic goverment | 3.4% | 81 |
| 216 | 2.2% | Financial income | 2.2% | 51 |
| 70 | 0.7% | Other income (incl. exceptional revenue item) | 0.9% | 22 |
| 9 638 | 100% | 100% | 2 364 |
Across the Pan-European system, traffic in 2024 (measured in composite flight-hours) increased by +5.5% compared to 2023 and exceeded the 2019 level by +1.6%. Meanwhile, total gate-to-gate revenues grew faster than traffic, rising by +7.4% (or +€829M) and surpassing 2019 revenues by +3.7%. As detailed in the following sections of this report, the increase in revenues in 2024 outpaced the rise in ATM/CNS costs and coincided with ongoing increases in capital and reserves as well as reductions in borrowings at the Pan-European system level.
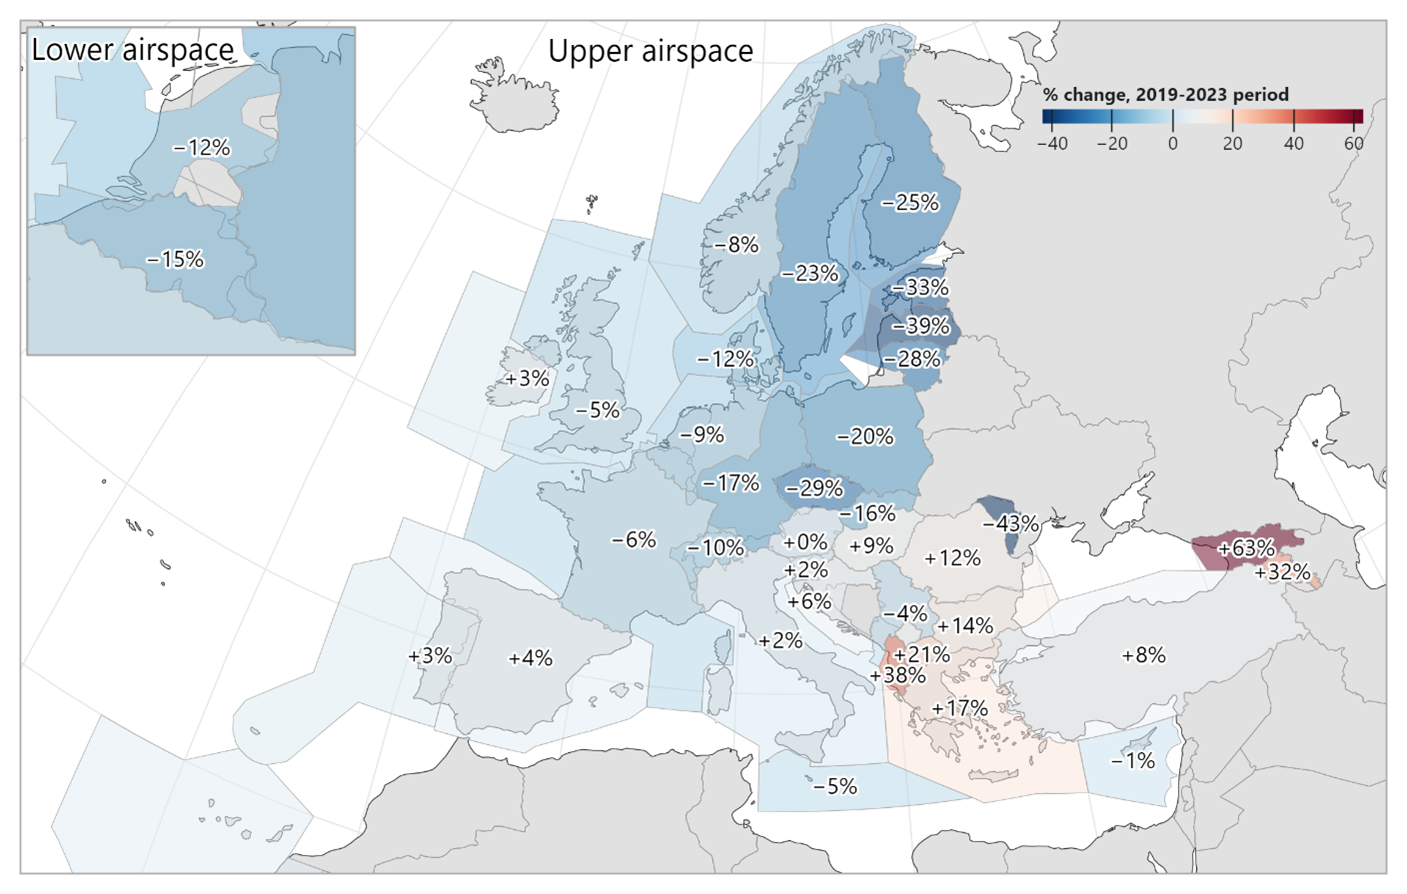
At ANSP level, traffic in 2024 showed varied patterns of recovery, influenced both by the residual effects of the COVID-19 pandemic and by the ongoing war in Ukraine, which led to significant changes in route structures and traffic volumes due to airspace closures and reciprocal sanctions on air carriers (see Figure 2.3). On the recovery side, some ANSPs such as Sakaeronavigatsia and Albcontrol recorded substantial increases in composite flight-hours, reaching +116% and +68% above 2019 levels respectively. In contrast, others like LGS and EANS remained below pre-pandemic levels, at -32% and - 23%, respectively. This inevitably impacted the levels and trends of ACE indicators for the most affected ANSPs.
2.2 Costs
The ACE benchmarking analysis focuses on the specific costs of providing gate-to-gate ATM/CNS services, which amounted to €10 468M in 2024. Operating costs (including staff costs, non-staff operating costs and exceptional cost items) accounted for some 84% of total ATM/CNS provision costs, while depreciation costs and the cost of capital represented around 16%.
En-route
|
Terminal
|
Gate-to-gate
|
||||
|---|---|---|---|---|---|---|
| € M | % | € M | % | € M | % | |
| Staff costs | 5 427 | 66.8% | 1 529 | 65.1% | 6 956 | 66.5% |
| ATCOs in OPS employment costs | 2 653 | n.a. | 807 | n.a. | 3 460 | n.a. |
| Other staff employment costs | 2 774 | n.a. | 722 | n.a. | 3 496 | n.a. |
| Non-staff operating costs | 1 447 | 17.8% | 387 | 16.5% | 1 835 | 17.5% |
| Depreciation costs | 811 | 10.0% | 227 | 9.7% | 1 037 | 9.9% |
| Cost of capital | 409 | 5.0% | 179 | 7.6% | 588 | 5.6% |
| Exceptional items | 25 | 0.3% | 27 | 1.2% | 52 | 0.5% |
| Total ATM/CNS provision costs | 8 119 | 100.0% | 2 349 | 100.0% | 10 468 | 100.0% |
Between 2023 and 2024, ATM/CNS provision costs increased by +4.0% (+€405M), reaching a level slightly above that recorded in 2019 (+0.6%). The main drivers were higher staff costs (+€272M), non-staff operating costs (+€90M) and depreciation costs (+€88M), while the cost of capital decreased (-€74M).
In 2024, the six largest ANSPs in terms of costs (DSNA, DFS, ENAIRE, NATS, ENAV and DHMI) bore some 58% of the total Pan-European gate-to-gate ATM/CNS provision costs, while the six smallest ANSPs accounted for some 1% (see bottom left part of Figure 2.6).
Trends in ATM/CNS provision costs at Pan-European system level
2.3 Staff
The Pan-European ANSPs employed a total of 54 888 staff (expressed in Full Time Equivalents – FTEs) in 2024 (comprising 54 073 staff providing ATM/CNS services and 815 internal MET staff). Some 17 584 staff (33%) were ATCOs working on operational duties, split between ACCs (55%) and APP/TWR facilities (45%). On average, 2.1 additional staff were required for every ATCO in OPS in Europe.
In 2024, the number of ATM/CNS staff increased by +2.8% (+1 478 FTEs) compared to 2023, surpassing the 2019 level by +2.0%. Compared to 2019, both ATCOs in OPS and support staff were +2.0% higher in 2024.
The overall change in staff numbers between 2023 and 2024 was mainly driven by the following categories:
- Technical support staff for operational maintenance, monitoring and control: +513 FTEs (+5.9%);
- Administrative staff: +269 FTEs (+3.1%);
- ATCOs in OPS: +237 FTEs (+1.4%), partly offset by a reduction in ATCOs on other duties (-51 FTEs, -2.2%); and,
- Technical support staff for planning and development: +133 FTEs (+4.3%).
Most other categories recorded increases, except Other Staff, which slightly declined (-0.8%), as shown in Figure 2.8. The largest proportional increase was observed in ab-initio trainees (+12.6%), indicating that some ANSPs expanded recruitment of future ATCOs in 2024. More detailed information on staff numbers will be provided in the upcoming ACE report, including comparisons to both 2023 and 2019 levels.
2.4 Balance sheet structure and capital expenditures
ANSP balance sheets in 2024 comprised €10 345M in capital and reserves and €5 466M in borrowings, while capital expenditure amounted to €1 474M.
In 2024, capital and reserves increased by +8% (+€809M), while the level of indebtedness continued to decline, falling by -10% (-€608M). Although the amount of debt remained significantly higher than in 2019, this indicates a clear improvement in the financial position of ANSPs. The traffic rebound since 2021, the subsequent increase in cash from operations and the gradual adaptation to a new traffic distribution shaped by the ongoing war in Ukraine created a favourable environment to increase capital expenditures (+19% in 2024).
ANSPs’ cash and liquidity situation is outlined in more detail in Chapter 5.